
 Menu
Menu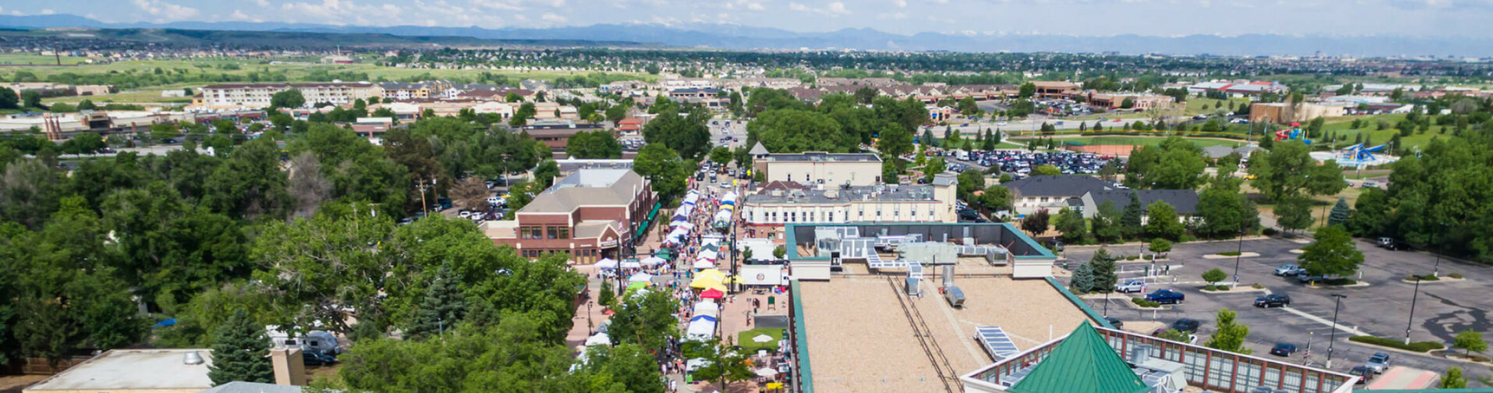
Homes Parker Colorado
Presented by James T. Wanzeck
Homes Parker Colorado
Immerse yourself in the captivating allure of Parker, Colorado, a city with roots dating back to the gold rush days of 1864. Traverse the historic main street, home to an enticing selection of boutiques and eateries that showcase Parker's unique charm.
The Parker Arts and Cultural Center stands as a hub of creativity, featuring art exhibits, classes, theater productions, and performances by the Parker Symphony Orchestra.
The devoted civic leaders of our community tirelessly provide residents with enriching resources, reinforcing the hometown feel of Parker, making it more than just a place to live, but a place to truly belong.
List of Zipcodes in Homes Parker Colorado
| Zip Code | Zip Code Name | Zip Code Population |
|---|---|---|
| 80134 | Parker | 75,123 |
| 80138 | Parker | 35,190 |
Source: Census Bureau
Demographics
State
Colorado
County
Douglas County
City
Parker
Population
60,019
| Zip Code | City | County | State | National | |
|---|---|---|---|---|---|
| Population | 35,190 | 60,019 | 351,154 | 5,759,582 | 331,426,769 |
| Population Density | 556.6 | 2,800.7 | 1,167.0 | 55.5 | 93.8 |
| Percent Male | 49.0% | 50.0% | 50.0% | 49.0% | 49.0% |
| Percent Female | 51.0% | 50.0% | 50.0% | 51.0% | 51.0% |
| Median Age | 41.2 | 36.9 | 41.0 | 40.2 | 39.0 |
| People per Household | 2.9 | 2.8 | 2.9 | 2.8 | 2.6 |
| Median Household Income | $123,502 | $110,970 | $114,156 | $115,942 | $61,963 |
| Average Income per Capital | $47,738 | $44,005 | $61,155 | $50,725 | $33,235 |
Source: Census Bureau
Market Data
| Zip Code | City | County | State | National | |
|---|---|---|---|---|---|
| Median Sale Price | $540,000 | $498,100 | $550,500 | $425,100 | $277,796 |
| Median Age of Home | 35.0 | 32.0 | 33.0 | 39.0 | 49.0 |
| Homes Owned | 81.0% | 76.0% | 77.0% | 67.0% | 58.0% |
| Homes Rented | 16.0% | 21.0% | 18.0% | 23.0% | 31.0% |
| Homes Vacant | 3.0% | 3.0% | 4.0% | 4.0% | 11.0% |
Sources: Census Bureau / Homendo
Source: REcolorado
This free service is provided by your local Agent
How much is your Home worth? Click here to know...
Review current market value estimates for your home, or anyone else, anywhere in the USA.
46 properties on market in Homes Parker Colorado
 Active
Townhome
Active
Townhome
MLS# 4572797 | 2025-07-05T13:32:16.245Z
 Active
Townhome
Active
Townhome
MLS# 7894204 | 2025-07-05T01:51:16.263Z
 Active
Townhome
Active
Townhome
MLS# 5677800 | 2025-07-04T19:49:05.863
 Coming Soon
Townhome
Coming Soon
Townhome
MLS# 6518818 | 2025-07-03T22:40:18.993Z
 Active
Townhome
Active
Townhome
MLS# 6058083 | 2025-07-03T21:24:16.620Z
 Active
Townhome
Active
Townhome
MLS# 7820531 | 2025-07-01T14:48:16.348Z
 Active
Townhome
Active
Townhome
MLS# 4200645 | 2025-07-01T00:03:18.082Z
 Active
Townhome
Active
Townhome
MLS# 9002087 | 2025-06-30T23:17:16.520Z
 Active
Townhome
Active
Townhome
MLS# 5445466 | 2025-06-30T13:37:16.374Z
This free service is provided by your local Agent
Need more listings? Click here to search now...
15 minutes updated and accurate properties direct from your local agent. Home Evaluation. Get Loan Pre-Qualified.

James T. Wanzeck
RE/MAX Professionals
6020 Greenwood Plaza Boulevard
Greenwood Village, CO 80111, USA
6020 Greenwood Plaza Boulevard
Greenwood Village, CO 80111, USA
- (303) 887-1600 (Mobile)
- Invitation Code: masters
- jim@jimwanzeck.com
- https://JimWanzeck.com
Contact Me
Quality of Life
Cost of Living
119.0
Health Cost Index
128.0
Commute Time
29.0
Working from Home
7.0%
| Zip Code | City | County | State | National | |
|---|---|---|---|---|---|
| Cost of Living Index | 119.0 | 115.0 | 116.0 | 110.0 | 100.0 |
| Health Cost Index | 128.0 | 123.0 | 124.0 | 119.0 | 100.0 |
| Commute Time | 29.0 | 27.0 | 27.0 | 25.0 | 24.8 |
| Commuting by Bus | 1.0% | 1.0% | 2.0% | 1.2% | 2.1% |
| Commuting by Carpool | 9.0% | 10.0% | 8.0% | 11.0% | 13.5% |
| Commuting by Auto | 82.0% | 82.0% | 83.0% | 80.0% | 79.1% |
| Working at Home | 7.0% | 7.0% | 7.0% | 5.2% | 4.7% |
Source: Census Bureau
Walk Score®
Source: Walk Score®
Climate & Environment
January Average Low Temperature
17.8 °F
July Average High Temperature
85.4 °F
Annual Precipitation (inch)
15 inches
| Zip Code | City | County | State | National | |
|---|---|---|---|---|---|
| January Average Low Temperature | 17.8 °F | 17.8 °F | 15.9 °F | 13.7 °F | 22.6 °F |
| July Average High Temperature | 85.4 °F | 85.4 °F | 89.5 °F | 77.5 °F | 86.1 °F |
| Annual Precipitation (inch) | 15 in. | 15 in. | 18 in. | 19 in. | 38 in. |
Source: NOAA Climate
Schools & Education
Source: Great Schools
Safety & Crime
Violent Crimes
385.3
Property Crimes
1,515.6
| Zip Code | City | County | State | National | |
|---|---|---|---|---|---|
Violent CrimesCalculated annually per 100,000 residents |
|||||
| Assault | 156.5 | 206.1 | 69.5 | 246.3 | 250.2 |
| Murder | 2.2 | 2.3 | 2.2 | 3.8 | 5.0 |
| Rape | 68.3 | 68.2 | 33.6 | 67.2 | 42.6 |
| Robbery | 158.4 | 113.4 | 19.2 | 63.6 | 81.6 |
Property CrimesCalculated annually per 100,000 residents |
|||||
| Burglary | 222.9 | 218.9 | 230.1 | 348.4 | 340.5 |
| Theft | 770.8 | 922.8 | 1,794.6 | 1,858.3 | 1,549.5 |
| Motor Vehicle Theft | 521.9 | 1,711.4 | 88.7 | 384.0 | 219.9 |
Source: FBI - Crime Data Explorer

Take a photo of this QR code
to keep this website details